# Line, Bar, Radar Charts
Charts support is disabled by default. When enabled you can render line, bar, pie, radar, and radial charts on any slide.
### Activation
To enable the charts plugin for your slide deck activate the `charts` setting in your [PITCHME.yaml](/conventions/pitchme-yaml.md):
```yaml
charts: true
```
Once this setting is enabled, a chart can be included on any slide by adding a canvas element with the _data-chart_ attribute set to the desired chart type. The chart can be configured within the canvas body by a JSON string embedded into an HTML comment.
?> For additional details see the documentation for the [reveal.js plugin for Chart.js](https://github.com/rajgoel/reveal.js-plugins/tree/master/chart).
### Line Chart
To render a line chart you must declare a **canvas** element on your slide. This required element takes a **data-chart** property. And that property value determines the style of chart rendered for your custom data. For a line chart, this property value must be set to **line**. For example:
```text
```
Please note the following:
- Your chart properties must be defined as a JSON string within HTML comment syntax
- You can add as many data elements as needed inside the **datasets** array.
- The number of elements within the top-level **labels** property value should match the size of the **data** arrays specified within **datasets**.
- Each element within **datasets** must provide a **data** property, plus optional but recommended properties including **label**, and **backgroundColor**.
This sample markup snippet is rendered as follows:

### Bar Chart
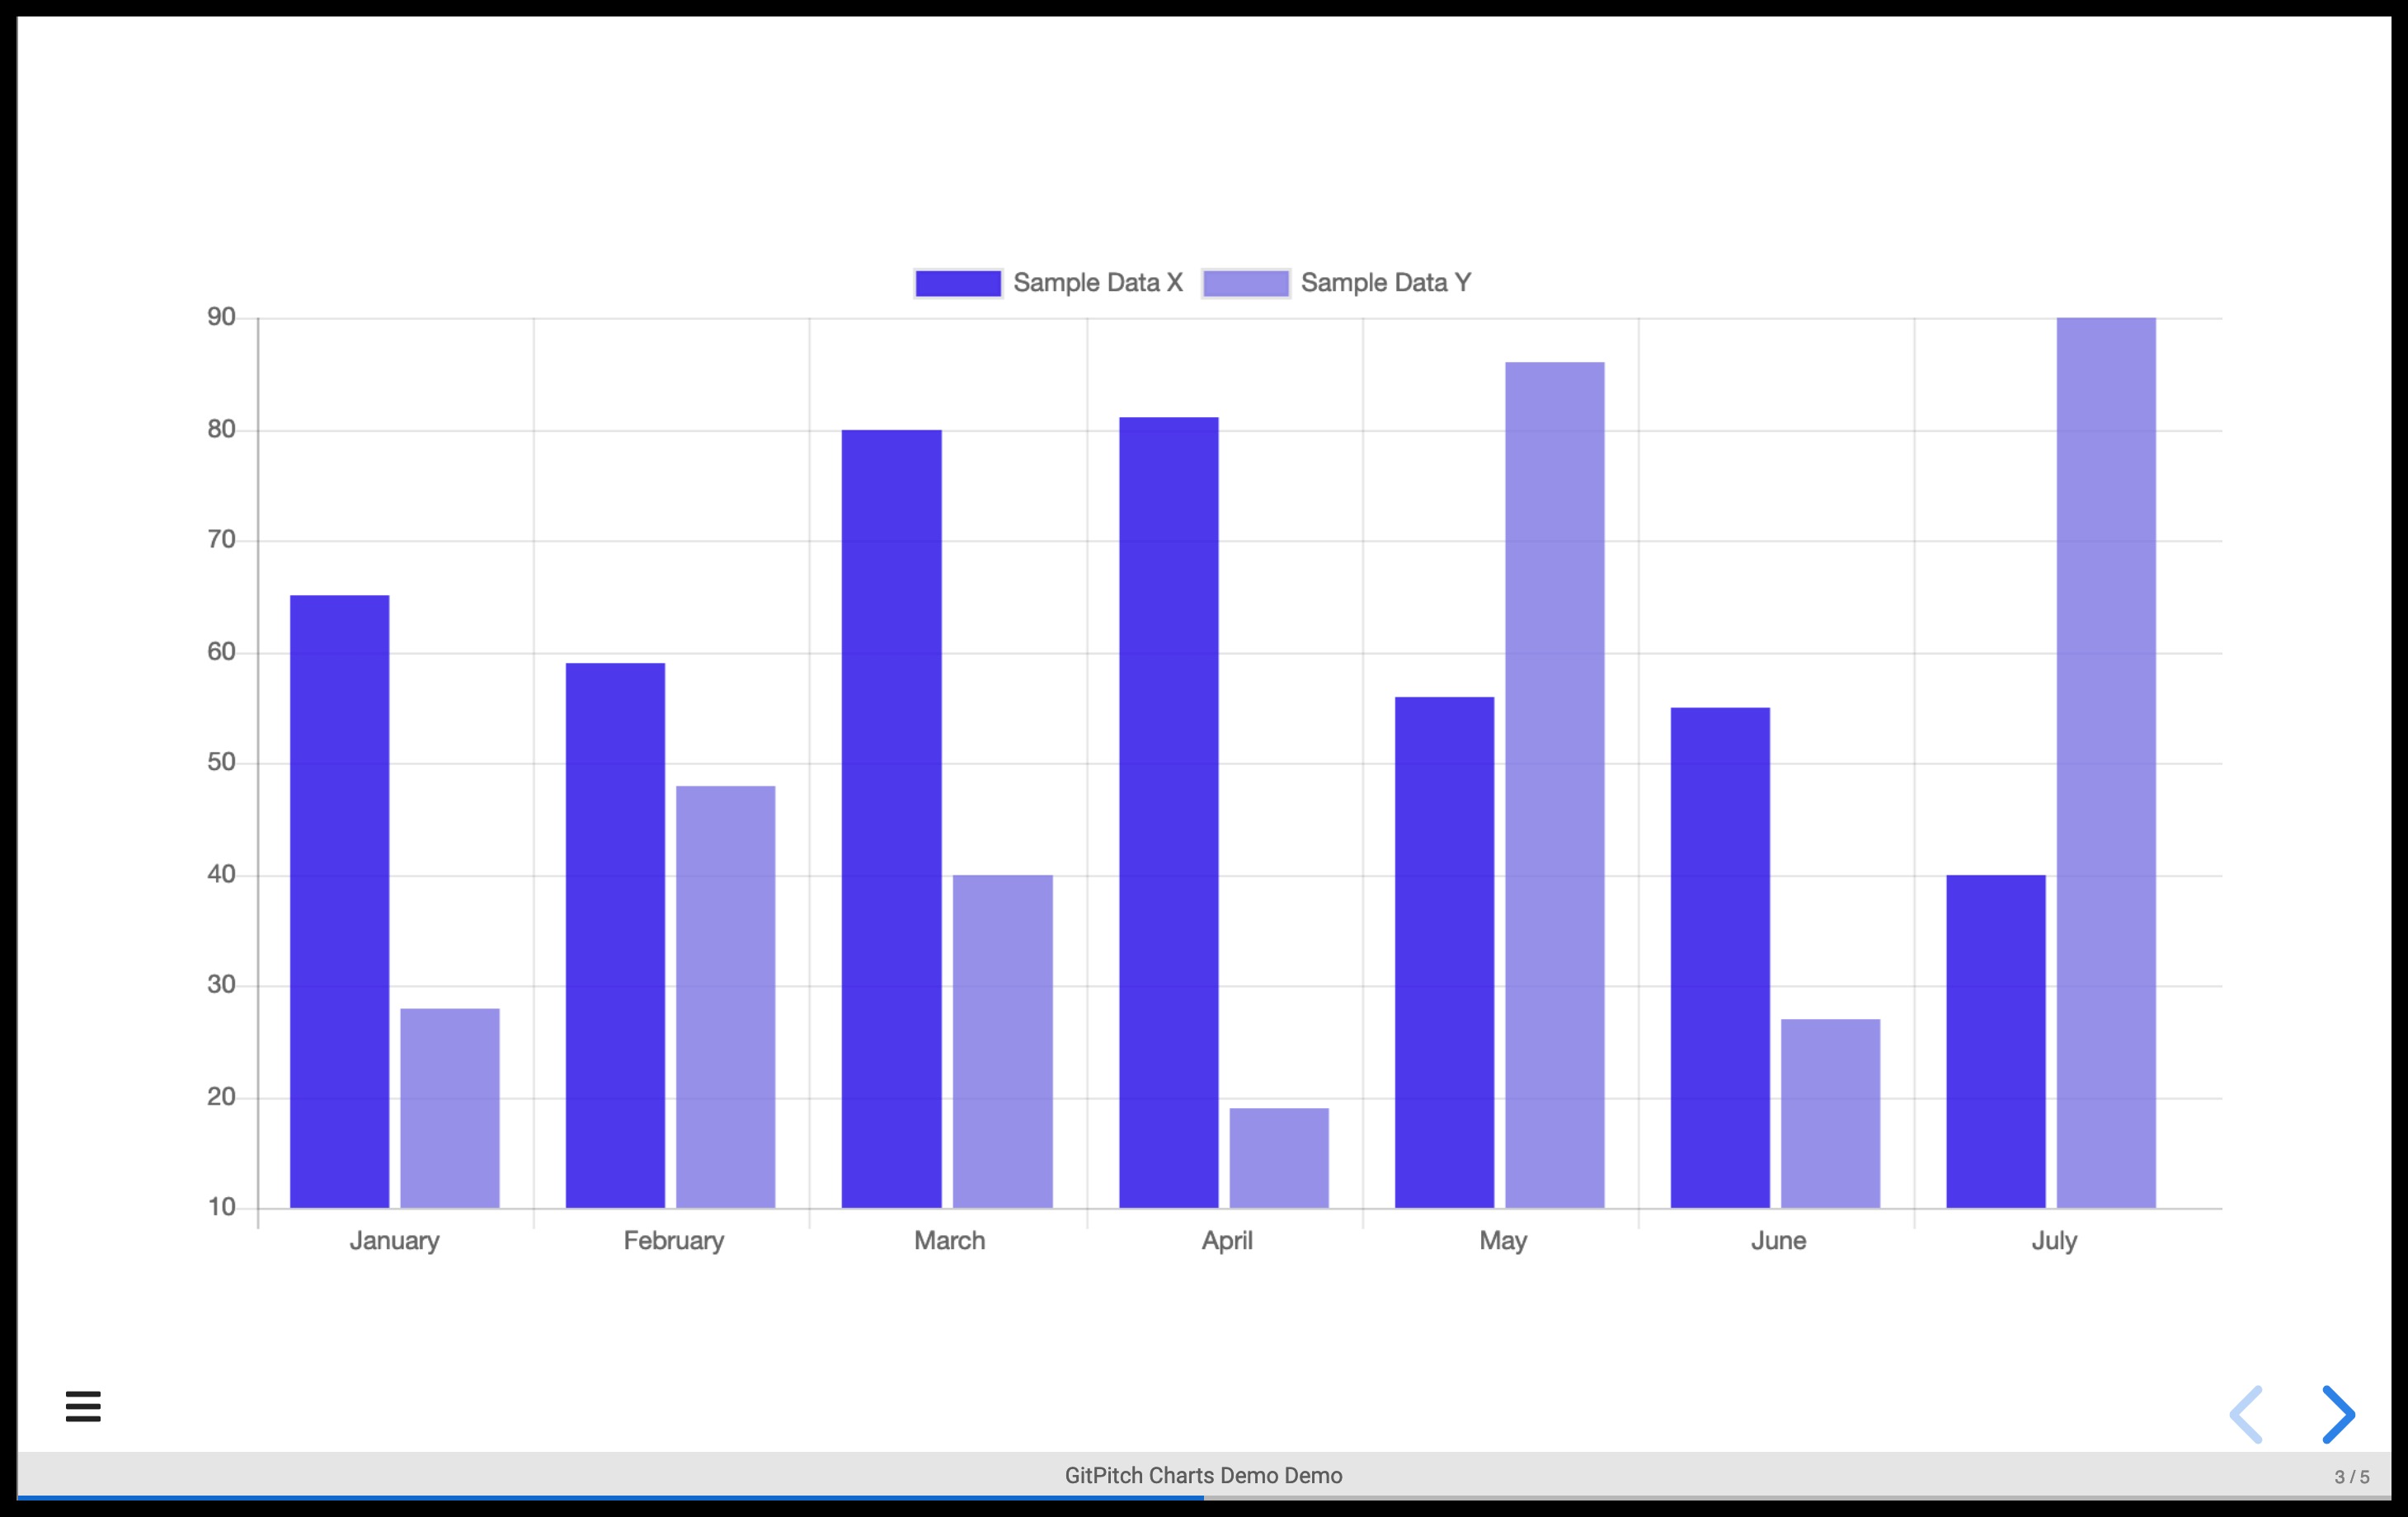
To render a bar chart you must declare a **canvas** element on your slide. This required element takes a **data-chart** property. And that property value determines the style of chart rendered for your custom data. For a bar chart, this property value must be set to **bar**. For example:
```text
```
Please note the following:
- Your chart properties must be defined as a JSON string within HTML comment syntax
- You can add as many data elements as needed inside the **datasets**
- You can add as many data elements as needed inside the **datasets** array.
- The number of elements within the top-level **labels** property value should match the size of the **data** arrays specified within **datasets**.
- Each element within **datasets** must provide a **data** property, plus optional but recommended properties including **label**, and **backgroundColor**.
This sample markup snippet is rendered as follows:

### Radar Chart
To render a radar chart you must declare a **canvas** element on your slide. This required element takes a **data-chart** property. And that property value determines the style of chart rendered for your custom data. For a radar chart, this property value must be set to **radar**. For example:
```text
```
Please note the following:
- Your chart properties must be defined as a JSON string within HTML comment syntax
- You can add as many data elements as needed inside the **datasets**
- You can add as many data elements as needed inside the **datasets** array.
- The number of elements within the top-level **labels** property value should match the size of the **data** arrays specified within **datasets**.
- Each element within **datasets** must provide a **data** property, plus optional but recommended properties including **label**, and **backgroundColor**.
This sample markup snippet is rendered as follows:

### External Data
If your chart is driven by an external _csv_ data file you must specify an absolute URL to that file. If your _csv_ data file lives in your GitHub repo then you will need to use the absolute URL to the raw file. Relative paths to data files *are not supported*.